lengthEstimators
Generates multigrid length estimations of paramteric shapes using DGtal library.
It will output length estimations (and timings) using several algorithms for decreasing grid steps.
Usage: LengthEstimators [options] –shape <shapeName>
Allowed options are :
-h,--help Print this help message and exit
-l,--list List all available shapes
-s,--shape TEXT Shape name
-R,--radius FLOAT Radius of the shape
-A,--axis1 FLOAT Half big axis of the shape (ellipse)
-a,--axis2 FLOAT Half small axis of the shape (ellipse)
-r,--smallradius FLOAT=5 Small radius of the shape (default 5)
-v,--varsmallradius FLOAT=5 Variable small radius of the shape (default 5)
-k UINT=3 Number of branches or corners the shape (default 3)
--phi FLOAT=0 Phase of the shape (in radian, default 0.0)
-w,--width FLOAT=10 Width of the shape (default 10.0)
-p,--power FLOAT=2 Power of the metric (default 2.0)
--hMin FLOAT=0.0001 Minimum value for the grid step h (double, default 0.0001)
--steps INT=32 Number of multigrid steps between 1 and hMin (integer, default 32)
T power(const T &aVal, const unsigned int exponent)
The list of 2D shape are : -ball Ball for the Euclidean metric. Required parameter(s): –radius [-R]
- square square (no signature). Required parameter(s): –width [-w]
- lpball Ball for the l_power metric (no signature). Required parameter(s): –radius [-R], –power [-p]
- flower Flower with k petals. Required parameter(s): –radius [-R], –varsmallradius [-v], –k [-k], –phi
- ngon Regular k-gon. Required parameter(s): –radius [-R], –k [-k], –phi
- accflower Accelerated Flower with k petals. Required parameter(s): –radius [-R], –varsmallradius [-v], –k [-k], –phi
- ellipse Ellipse. Required parameter(s): –axis1 [-A], –axis2 [-a], –phi
Example:
Application of the multigrid length estimation on a flower shape with 5 petals and maximal radius 20 and min 5:
$ lengthEstimators -s flower -k 5 -R 20 -r 5 --steps 256 > length.dat
You can display using gnuplot:
$ gnuplot
gnuplot> plot [0:][-0.5: 90] 'length.dat' using 1:(($7-$3)*($7-$3)) w l title "squared error length estimation using DSS", 'length.dat' using 1:(($8-$3)*($8-$3)) w l title "squared error length estimation using MLP", 'length.dat' using 1:(($9-$3)*($9-$3)) w l title "squared error length estimation using FP" linewidth 2
You should obtain such a result:
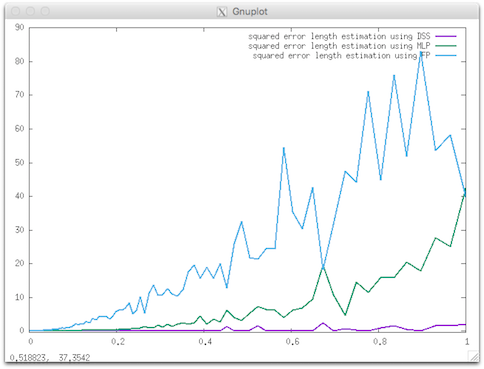
Resulting visualization.
- See also
- lengthEstimators.cpp